So far in the second half of the Toronto Blue Jays’ 2015 season, Justin Smoak has had 111 Plate Appearances (PA). During that span, he has a Weighted On-Base Average (wOBA) of .257 and a Weighted Runs Created Plus (wRC+) of 57. During that same span, Chris Colabello has had just 79 PA, but has a wOBA of .381 and a wRC+ of 144. That is a huge gap between the two players, yet Smoak continues to get the majority of the playing time at first base. Many argue that Colabello’s ridiculously high Batting Average on Balls in Play (BABIP) of .399 for the season and poor defense are the reasons that Smoak is getting the majority of the playing time. I’m here to show you why that’s wrong by comparing the two players’ offense and defense.
[Side note: I will be using a lot of advanced statistics in this post. If you need more information on these statistics, head on over to Fangraphs and check out their glossary. Also, most of the data in this post comes right from the Fangraphs website.]
Offense
It’s easy to see who has been more productive at the plate this year. Colabello’s wOBA and wRC+ are .378 and 142, respectively, good enough for third on the team, just behind Josh Donaldson (.406, 161) and Edwin Encarnacion (.381, 144). Smoak’s wOBA and wRC+ are .313 and 96, putting him at 11th place on the team. His numbers in the second half have been even worse (.257, 57), while Colabello’s numbers have not only remained high, but slightly improved (.381, 144). I think it’s clear who has been the more productive hitter to date, so there’s no need to expand beyond that.
What we do need to focus on is the fact that Colabello’s BABIP is .399, which is the highest on the team and fourth highest in baseball (minimum 100 PA). Only Miguel Sano of the Minnesota Twins, Stephen Piscotty of the St. Louis Cardinals, and Miguel Cabrera of the Detroit Tigers have higher BABIPs than Colabello. A very high BABIP usually means that a player is getting lucky with hits and batted ball placement, and over time, their luck will change, their BABIP will regress to their mean, and so will their other on base numbers. The average BABIP is around .300, but Colabello’s career BABIP is .337. Since 2012, the other Major League players with a BABIP of .337 (minimum 500 PA) are Michael Cuddyer (2011, 2013 All-Star), Freddie Freeman (2013, 2014 All-Star), J.D. Martinez (2015 All-Star), and Michael Bourn (2010, 2012 All-Star). Chris Colabello did not make the All-Star team this year, even though he was sporting an identical wOBA/wRC+ of .377/141 as… wait for it…
Josh Donaldson. That’s right; the guy with the MVP chants.
So what it really comes down to is sample size: Donaldson had 394 PA in the first half, Colabello just 221. So while his advanced and weighted averages were borderline amazing, his traditional stats that we are used to seeing on telecasts and baseball cards were less impressive. The batting average and on-base percentage were, obviously, higher than average, but he hit just 8 home runs and had 32 RBI; Donaldson hit 21 home runs and 60 RBI.
Going back to BABIP, Colabello’s is high, no one will dispute that. But the question is, how much higher is it than what it should be? That is, what is Colabello’s “normal” BABIP? Well, as already stated, for his career it’s .337, but that number has only increased in his three major league years. With the Twins in 2013 and 2014, his BABIP for the season rose from .253 to .308. Now with the Blue Jays this season, it’s at .399. The sample size is small, but from what we’ve seen, the man has a knack for putting the ball in the right spot.
But again, this article isn’t about how good or not good Chris Colabello is, it’s whether he should be starting over Justin Smoak.
So back to Smoak…
Justin Smoak is not a good offensive baseball player. He is average to slightly below average, with his career wOBA at .306 and wRC+ of 94. He had one decent year with the Mariners in 2013, but other than that, he’s been pretty much at or below replacement level, offensively. Just for perspective, his traditional career stats are .223 BA, .307 OBP, .386 Slugging Percentage, all below league average. This year has not been any better, as he is hitting just .215/.287/.438. Add to all that his slowness on the basepaths (he hasn’t stolen a base since 2012), and you have a guy you just don’t want in your batting order.
“But wait! He’s a switch hitter! The Blue Jays have a very right-hand dominant lineup. Surely he must be valuable against righties!”
He certainly is not valuable against righties, and don’t call me Shirley!
Smoak has a career batting average of .221 versus righties from the left side of the plate. Because advanced statistics are our friend and tell a better story, his career wOBA and wRC+ in that setup are .311/97. In fact, maybe he should bat right-handed against righties, because his career numbers in that setup are a .333 batting average and a whopping .423 wOBA and 175 wRC+!! Unfortunately, that was only in three plate appearances, and he got a double in one (yay). But back to this year, his numbers are even worse than his career R/L matchups: he’s batting just .203, with a .296 wOBA and 84 wRC+. So how is Colabello doing against righties? Well great, as you might have guessed, with a .327 batting average, .375 wOBA and 139 wRC+. In fact, if you want to talk about even giving Justin Smoak a pinch-hit against a righty, the only players that have struggled more than him are Kevin Pillar and Dioner Navarro.
So that’s that for offense. I think the nail is firmly in the coffin. Colabello is having an amazing year at the plate and has not shown any signs of slowing down. If you don’t believe that athletes can have “hot streaks” and that it’s merely a matter of a pattern in a large sample size, check out this article in the Washington Post on the topic. If you don’t want to read it all, I’ll just sum it up by saying: athletes are people, not dice. A string of good performances can turn into increased confidence, which can turn into increased production, which can turn into increased confidence, which can….okay you get it.
Defense
Defense is much more difficult to gauge statistically than hitting. Soon that will all change, though, thanks to MLB Advanced Media’s new tracking technology that just became installed at all major league ballparks this year. Until then, we’re stuck using defensive metrics that are based on humans making judgment calls on defensive plays.
One of the most popular ways to put a number on “how good” a baseball player is defensively is by a metric called Ultimate Zone Rating (UZR), which takes into account not just errors, but also their arm (if playing the outfield), their double play ability, and their range.
Now here’s where I will admit that Justin Smoak is better at something than Chris Colabello. Smoak has a UZR this year of 1.3 runs above average and a UZR/150 (which just scales the UZR to an average number of chances per season) of 4.1. Some reference points help to determine what this really means. For instance, a UZR/150 of 0 is average, 5 is above average, and 15 is Gold Glove Caliber. So Smoak’s defense this season has been almost above average.
Now let’s look at Chris Colabello’s defense at first base. Let’s not even talk about his outfield defense. Suffice to say I’d rather see Munenori Kawasaki doing some sort of handstand, scissor-leg stretch (?) against the wall than Colabello try to “field” one of the outfield positions. He’s just not good at it. And it’s been that way his whole career. First base, however, is another story. While still not considered good, his UZR this year is a -1.2, and his UZR/150 is an ugly -11.6. But this is another case of a sample size being too small to make a real conclusion. Colabello has only started 21 games at first this year, versus Smoak’s 57.
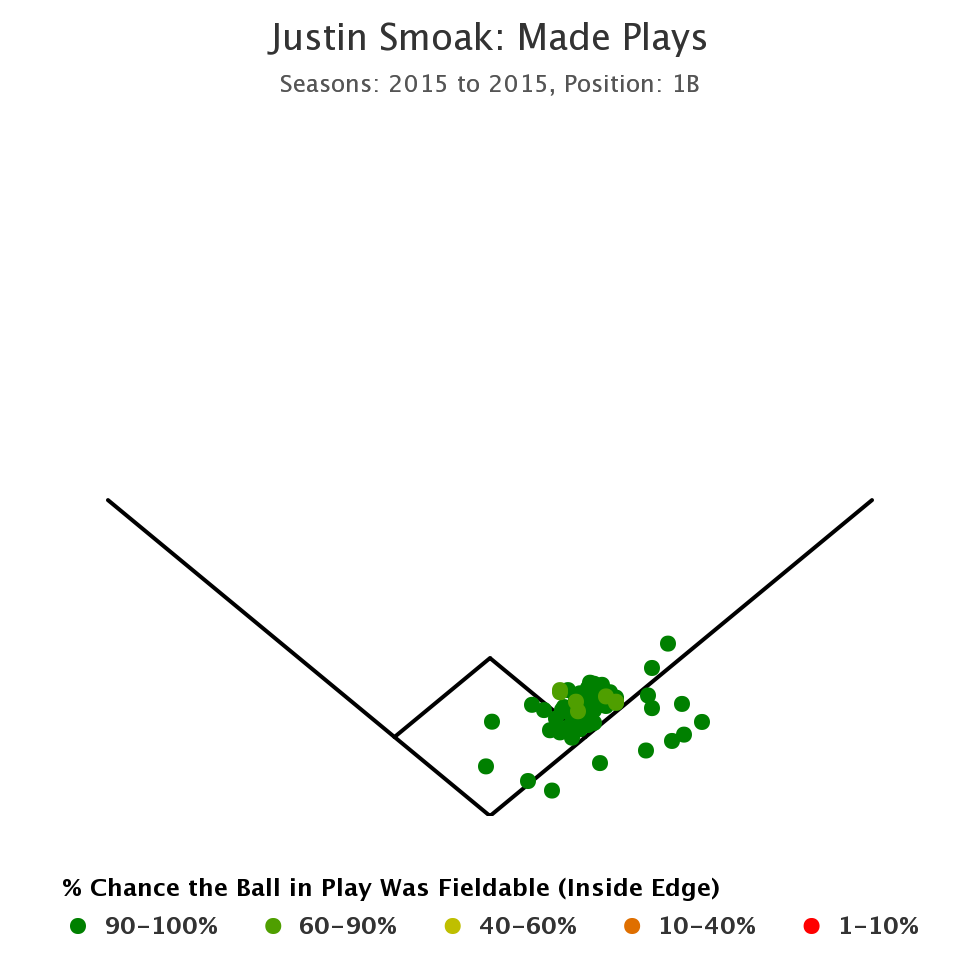
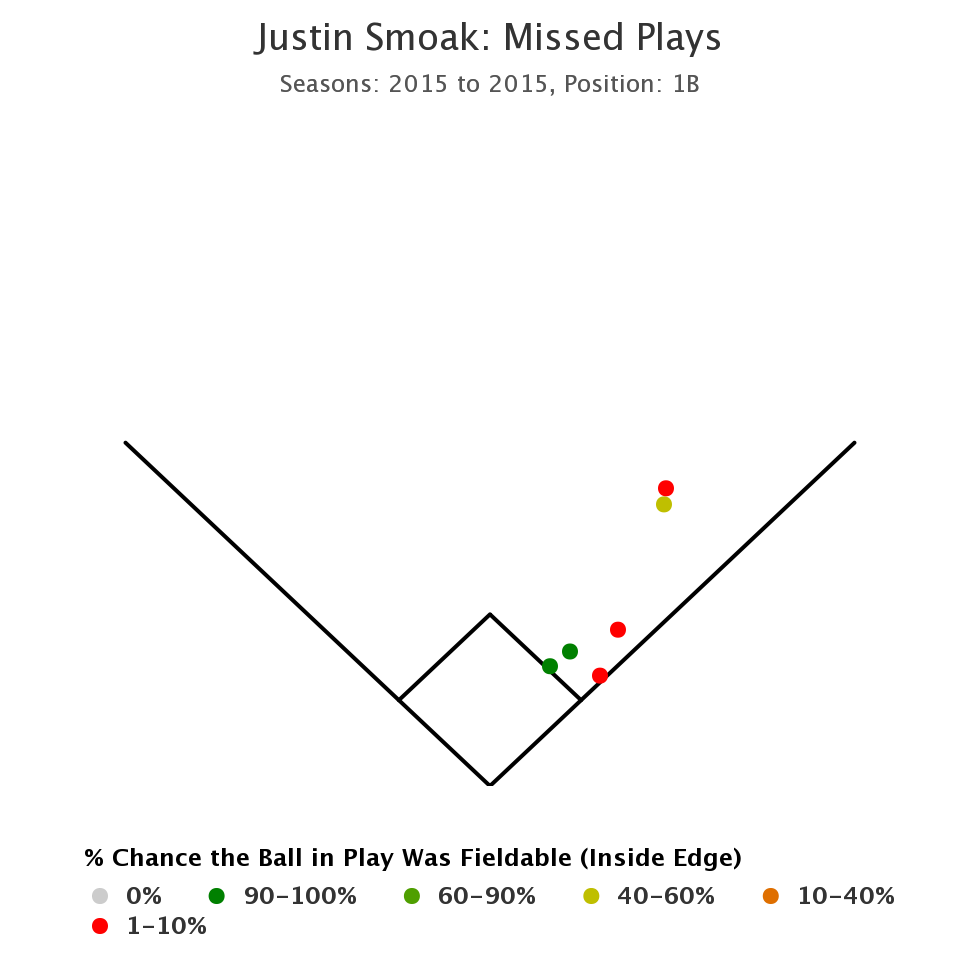
But there’s an even newer way to try to gauge defensive skills than UZR, and it’s called Inside Edge Fielding. In a nutshell, each play is reviewed by a person who rates how difficult that play should be, from “Impossible” to “Almost Certain / Certain,” and whether that player made the play or not. Fangraphs has graphs that show you the location of each play a player attempted, whether or not the player made it or not, and how difficult the play was. Here are those charts for Justin Smoak and Chris Colabello’s defense at first base this year:


Clearly there are more dots on Smoak’s maps because he’s played more first base and has been involved in more plays. But there is one point I wish to make here, and it’s on Smoak’s missed map. We’ll disregard the red dots because those were graded as only being able to be made 1-10% of the time. But there are two green dots (90-100%) and one bronze dot (40-60%). So Smoak has missed two plays that should have been “certain or almost certain” and one that was basically a 50/50. It’s not bad, but the reason I’m pointing it out is that Smoak has only been charged with one error, not two, as this chart would seem to indicate. In fact, one of those 90-100% balls that Smoak missed was ruled a single. That one difference of opinion between one person who called it an error and the other person who called it a single would have doubled Smoak’s errors on the season from 1 to 2. The reason I bring that up is because if you look at Colabello’s missed chart, he too missed a 50/50 shot, but missed only one 90-100% ball (which he did receive an error for). As it stands for the season, they both have the same amount of errors at first, even though Smoak has played far more innings there than Colabello.
So what is the point to all this nitpicking at called plays, and the difference between one error or two? Well it just is to prove the point that defensive measurements are much less accurate than hitting statistics because they rely so heavily on human judgement. It needs an even greater sample size than hitting to paint an accurate picture of the true defensive capabilities of a player, especially at first base where they are for the majority of their plays just catching a ball thrown to them by their teammate. If you want to talk about career numbers at first base, Colabello’s UZR/150 is -1.4 and Smoak’s is 0.4.
Summary
So there you have my case for why Colabello should be starting at first base every game over Smoak unless of an injury or a steep decline in performance (and that would have to be very steep, not just an 0 for 20 cold streak). At this point of the season, I don’t think there is enough time for Colabello to get so cold that it offsets all he has accomplished this year. He has without a doubt been better offensively, and even if he does tend to regress a bit for the rest of the year, he will still be much better than Smoak. Smoak’s defense is not that much better at first base than Colabello’s and certainly not enough to warrant his bat being in the lineup instead of Colabello’s.